Visualization Layer : Solution
How 3D Assets Power E-Commerce
Visualization
Solution
3D assets enable a range of advanced experiences that static visuals cannot offer, allowing brands to differentiate themselves through superior digital experiences.
The Proof. Measurable ROI and Performance Impact
3D visualization delivers a powerful dual Return on Investment (ROI) by both significantly boosting revenue metrics and driving massive operational cost savings. Additionally, customers spend an average of 20 seconds interacting with 3D content, demonstrating high engagement levels that translate to better purchase decisions.
Key Metrics
Cost and Production Efficiency Compared to Traditional Photography
3D virtual photography offers definitive financial superiority and scalability over traditional photography.
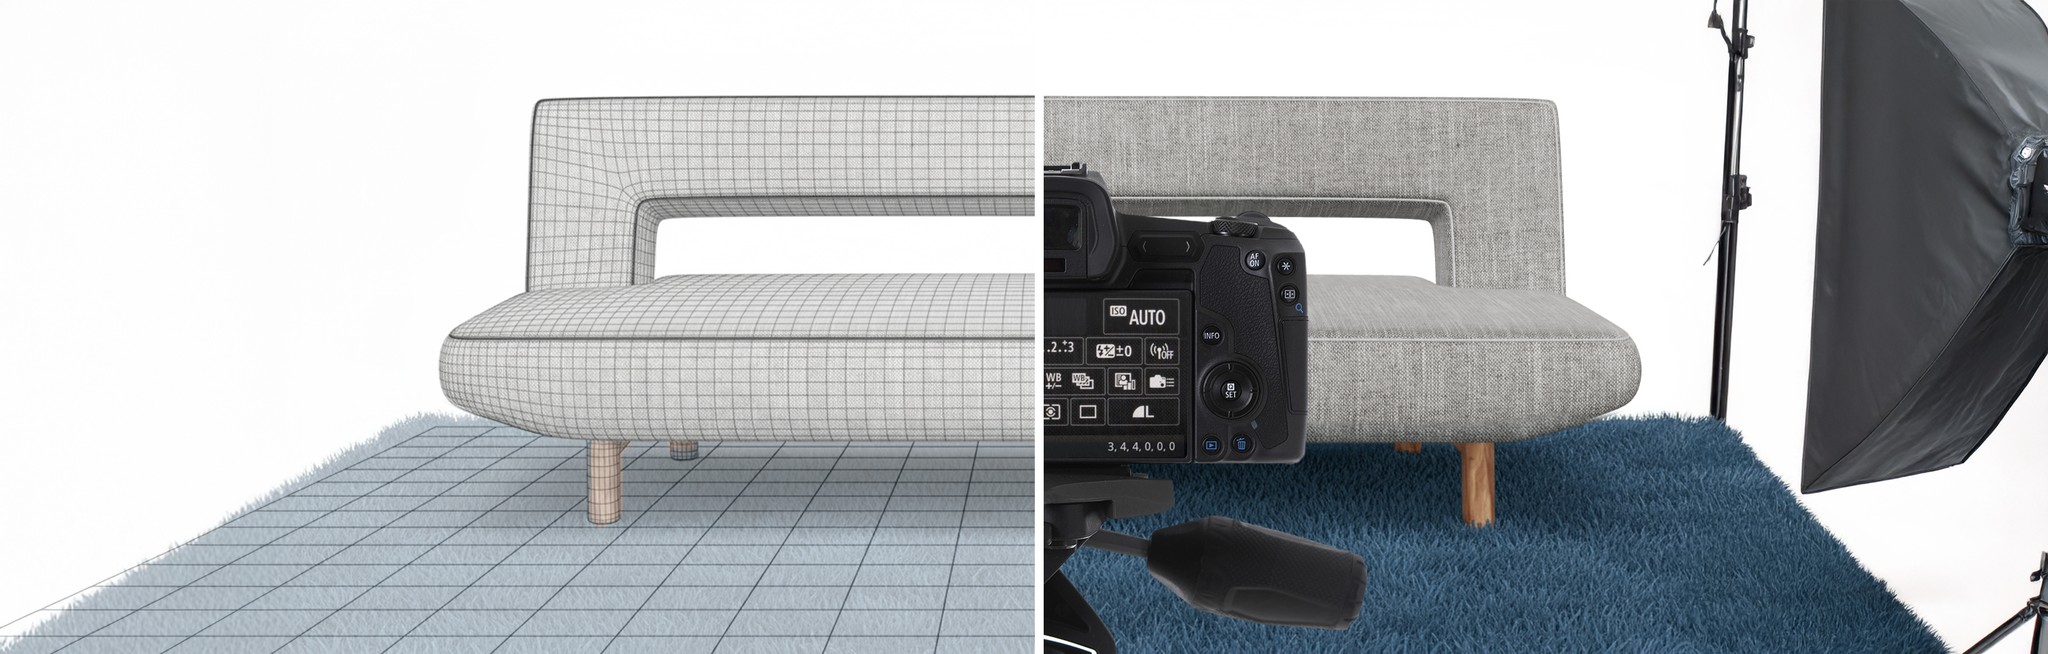
Cost Efficiency:
3D virtual photography is proven to be up to 6 times more cost-effective than traditional photography methods.
Cost Comparison:
The global average cost for a traditional photoshoot involving five high-end products (30 visuals total) is approximately $11,076.
In contrast, 3D virtual photography delivers the same volume and quality of assets for a fixed price of just $2,000.
This fixed pricing eliminates the geographic cost volatility seen in traditional methods, where prices can soar to $17,952 in cities like New York.Production Velocity:
A major furniture retailer documented a 70% reduction in content creation time after implementing 3D visualization tools.
AI-powered tools can reduce production time by up to 60% and cut costs by 60 to 80% for certain asset types.
| Aspect | 2D Images | 360 Images | 3D eCommerce Models |
|---|---|---|---|
| Visual Experience | Static, flat images | Interactive rotating view | Immersive and dynamic |
| Customer Engagement | Limited | Moderate | Extensive |
| Realism | Low | Moderate | High |
| Product Examination | Limited angles/views | 360-degree view | Detailed examination |
| Virtual Showroom Experience | Not available | Not available | Possible and immersive |
| Dimensional Perception | Limited | Improved | Realistic |
| Customization Options | Limited | Limited | Enhanced |
| User Experience | Passive | Semi-Interactive | Highly Interactive |
| Customer Confidence | Moderate | Improved | High |
| Conversion Rate | Average | Improved | High |
| Product Returns | Moderate | Reduced | Significantly Reduced |
Strategic and Sustainable Advantage
3D is not just a visual tool, it is a system that provides efficiency and sustainability in the long term.
Operational, Commercial, and Experiential Gains
Average Order Value (AOV):
3D configurators and other interactive 3D spaces enable customers to confidently select premium materials and upgrades, resulting in an Average Order Value increaseof 20 to 50 %.
Furthermore, 40% of online shoppers are willing to pay more for a product when presented through engaging 3D experiences.
Time-to-Market (TTM):
By utilizing the Digital Twin approach and generating marketing collateral from engineering CAD data, TTM is drastically accelerated.
Some large retailers have documented that using 3D renders helped cut 2 weeks from their internal design review process.Buyer Confidence and Loyalty:
The use of 3D configurators increases purchasing confidence for 66% of shoppers.
This enhanced confidence, coupled with interactive personalization (the IKEA effect), strengthens the emotional connection to the product, reducing post-purchase doubt and boosting loyalty.Scalability:
Since pricing for 3D virtual photography is fixed and unaffected by geographic location, brands can scale complex catalogs with hundreds of SKUs consistently and quickly.
Sustainability : Smarter, Greener, Faster

Sustainability:
3D visualization minimizes reliance on physical prototypes and sample development. Companies report a 50% reduction in physical samples required during the development process. This also leads to a 10 to 15% reduction in sample making costs.
This evolution highlights why 3D is becoming indispensable for modern commerce and sets the stage for the next section, where we examine the underlying problems it is designed to solve.
Not suitable for mobile use
Please use a desktop computer or tablet.
